
Treemapping is a great tool for data analysis because it allows you to see the big picture and the details at the same time. Treemap charts are one of the most efficient and visually appealing ways to represent hierarchical data. They can be used to display a variety of information, such as the size of files on a disk, the sales figures of a company, or the structure of a website. Treemap charts are a great way to visualize data, but they have their pros and cons. Keep reading to learn more about treemap charts. Keep reading to learn more about the benefits of treemapping.
What are treemap charts?
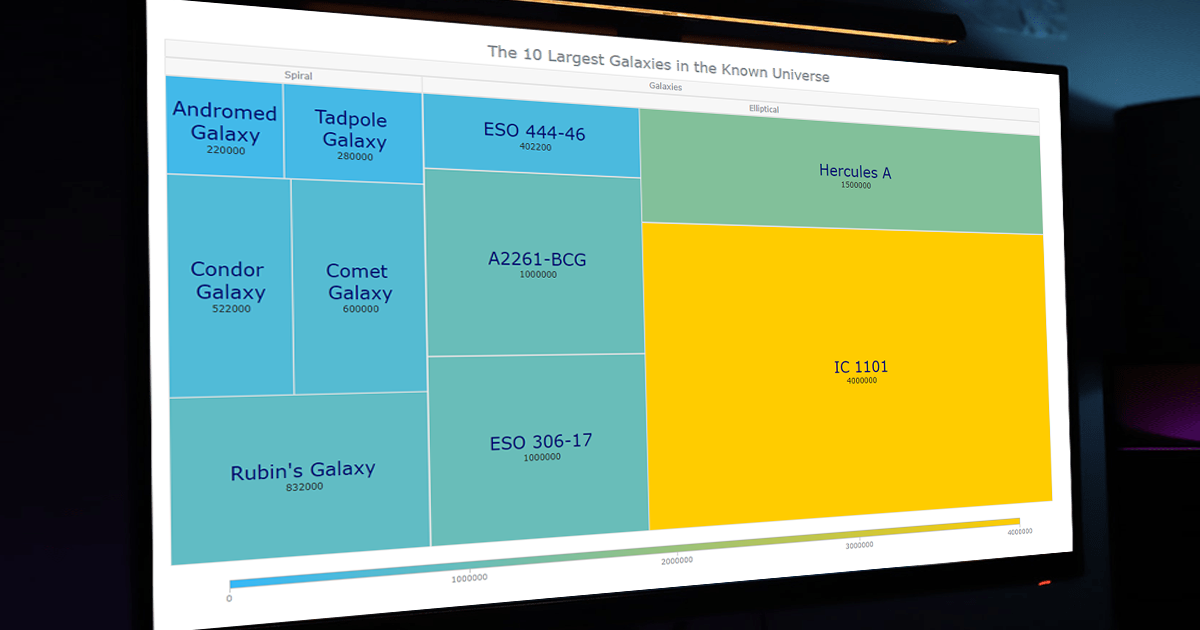
A treemap chart is a data visualization tool that displays hierarchical or nested data as a set of nested rectangles, with the largest rectangle representing the root node and its subordinate rectangles representing the child nodes. The width and height of each rectangle are proportional to the value of the data at that level. Treemapping can be used to display any type of hierarchical data, including organizational structures, product categories, and file systems.
One advantage of treemapping for data analysis is that it allows you to see how much detail is available at each level of the hierarchy. For example, you can use treemapping to compare the market shares for different products within a category or to explore the contents of a folder system. You can also use treemapping to identify patterns in the data, such as which products are most popular in certain regions or which folders are most frequently accessed.
Treemaps are effective at displaying large amounts of hierarchical data because they allow you to see all of the data at once without having to scroll or drill down. This makes them ideal for quickly understanding complex information sets. Additionally, because treemaps use color and size to encode information, they can be easily understood by people who are not familiar with a traditional bar and pie charts.
How do you analyze the data in a treemap?

In order to read treemap charts effectively, you need to understand how the charts are organized and how to interpret the data. Treemap charts are divided into a series of rectangles, with each rectangle representing a category. The size of the rectangle reflects the amount of data within that category, and the color reflects the type of data.
You can usually interpret the data in a treemap chart by looking at the percentages in the colored rectangles. For example, if you want to know what percentage of the data is in the blue category, you would look at the blue rectangle and see that it is 10%. You can also use the treemap chart to compare data between categories. For example, if you want to know what the difference is between the blue and green categories, you would look at the two rectangles and see that the green rectangle is larger. This means that the green category has more data than the blue category.
What are the limitations of treemapping for data analysis?
Treemapping is a great data visualization tool for analysis, but there are some limitations to its use. One limitation is that it can be difficult to accurately represent small values with traditional treemapping techniques. Another limitation is that treemapping does not always show the relationships between data points as clearly as other methods, such as scatter plots. However, these limitations do not outweigh the benefits of treemapping for data analysis, which include its ability to quickly and easily reveal patterns in data.
Overall, treemapping is an important tool for data analysis as it allows users to explore and understand data in a more comprehensive way. By displaying data in a tree structure, treemapping allows users to see relationships and patterns that may not be readily apparent in a traditional two-dimensional grid. Additionally, treemapping can be used to help identify and highlight outliers in data sets, as well as to track changes over time.